Forex Trading System

Forex Trading System

Developing a new Forex Trading System can take days, weeks, months or even years. Forex traders are always looking for the holy grail, but in the end it is up to you when it comes to trading. You are looking for an edge in the market and finding one can be quite difficult. As you know by now, we trade many different methods. We’ll be using our wick method using our Wick histogram indicator developed by “TRO”. This indicator made trading this method a lot easier and saves a lot of time.

We call this strategy the Wickity Whack Method or WWM for short. It follows price action during the day and can be traded at most times. Obviously certain times are better than others. This method can be used with any pair, but we’ve only tested it with the EURUSD.

There are a few reasons why we only use the EU:

The spread is usually low compared to other currency pairs which is important when scalping.

Movements are strong.

Wicks occur often enough so more trades are taken throughout the day.

The strategy is fairly simple in terms of what to do. The hardest part, is executing quickly enough in case you are not watching the market at the moment. The first thing you want to do is setup a five minute candle stick chart of the eurusd. We highly recommend you use the Metatrader platform for ease, not to mention that it is free. Multiple brokers offer this platform as a retail trading tool. All the brokers listed on this site have a Metatrader platform.

Once your candlestick chart is setup, whether you have the wick histogram indicator or not, all you’re looking for are 5 minute candles with wicks that are 10 pips or longer. If you see a wick that has a 10+ pip wick, then on the next candle you want to trade the reverse of the wick. Say the price is moving up and the wick forms pointing up. Then on the next five minute bar you will go short. You can either enter immediately or you can wait, giving the current candle some wiggle room to retrace toward the wick and then go short. Of course everything is the same for going long with the wick pointing the other direction.

Your goal is too scalp 5 pips or more. You can set a limit for this or you can use single click market orders to exit. Another method is to set a limit on half your position at 5 pips and then move your stop down to break even once the 5 pips is hit, so you can go after bigger profits. Sometimes you will only get as much as 5 pips, other times you can get dozens of pips. This is something you will need to test and demo, so you can get a better feel of how the WWM system works. Reminder: Don’t be greedy and let the Forex scalping work for you.

Should the trade go against you, you’ll have a stop loss, 2-5 pips away from the tip of the original wick you are trading against. The most you should place a stop for is 20 pips. If the original wick is over 15 pips, you should let the next candle retrace up the wick before entering. This gets you in a safer trade with less risk, but you may miss out on several good plays. Keep in mind anything can happen when trading so you need to act fast.

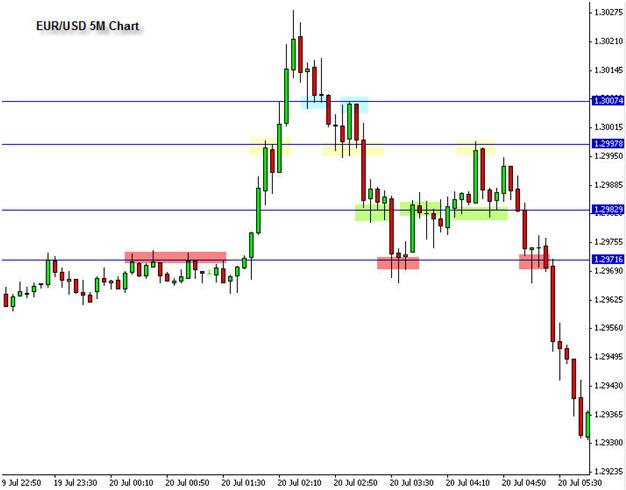
Here is a perfect setup for the WWM method:

Forex Trading Method

Forex Scalping the WWM – You enter short at 1.3212 and it had 25 pip profit potential.

Going forward we will keep this page updated with some of our latest WWM trades. We will also include some live trade on Video.

Here is a perfect trading session trading the wicks. You multiple opportunities to make trades, some were average size, but a couple of them had a lot of big time potential, if you sold half and moved your stop.

We Look Deeper

Scalping wicks all night long makes you a lot of pips

If you were around this morning trading the WWM you had some nice gainers, plus an account doubler.Plenty of trades available. Only patience is required
Make this Trade

1.16.2009
This is our first video about our wick trading method.
01.18.2009
Here is our latest video from the European trading session on Thrusday night into Friday morning.
01.19.2009
It’s not always the best to trade when there is a holiday. Here is a look at two trades that occurred Sunday night, so you wouldn’t even have to trade on Monday. In less than an hour you had pip profit potential of 70-80 pips on two trades.

Holiday Trading

Trading Before a Holiday

Developing your own strategy can be quite difficult. Make sure you cover all the main features of a trading plan and don’t fall in love with one strategy until you know it is favorable in a lot of markets.

Understanding Price Action Part Two

Understanding Price Action Part Two

Let’s get down to the specifics of how price moves. First, remember from Part 1 that price moves within patterns. Although it appears that price moves in a rather unpredictable, chaotic manner, a trained eye can see that it moves in patterns. These patterns are referred to as fractals. Although a fractal is a very involved and complicated geometric pattern, it can basically be defined as a pattern within a pattern, or a micro-pattern. This is how price moves—in micro patterns.

Let’s take a look at a chart.

Forex Price Action
Study the above chart and notice that price continually moves in an ebb and flow between these shaded boxes. This is a 5 minute chart, but price moves in this behavioral manner on all time frames. Let’s use the red shaded boxes as an example for our discussion. At red shaded box 1, price is finding resistance to the upside at 1.2971. Finally, price makes a nice clean break above the 2971 level. When price makes a clean break of resistance like this, you can be most assured that when price eventually comes back to that level later, it will now act as support. This is because of the human behavioral tendencies behind price.

And, of course, at red shaded box 2 this is exactly what happens. Price break up for a 50 pip move above the 2970 level, and then when if finally comes back down several hours later, the 2971 area now acts as support. If a trader would have entered the market long at 2970, he would have been up +28 pips after about an hour. This is how price moves again and again. You can see it all over this chart above. Using the Forex profit multiplier is all based on price action.

Take a look at the 1.2997 area, which is the blue line with the yellow shaded boxes. As price rises to the 2997 level the first time, it finds resistance at yellow shaded box 3. Then, after a few minutes it finally breaks to the upside. About an hour later, price revisits this level at box 4, and it now acts as support. Then, price eventually moves down lower for several hours and then rises to the 2971 level again at yellow shaded box 5 and, what do you, it acts as support again. This is how price moves.

Begin to simply sit down and watch price move on a 5 minute and 15 minute chart and notice how it continually stalls and bounces off of these levels. This is the natural ebb and flow of price action. Once you apply yourself to seeing this movement of price in the chart, you will eventually start to see exactly where price will always stall. But that is the easy part. The harder part is being able to identify which levels will actually hold long enough to give you a good payout of pips.

You don’t want to take trades at levels that will just hold price for a few minutes and offer maybe 5 pips. You want to find the levels that are going to offer good reversals, where price may move 10, 20, or 30+ pips. In Part 3 of this Special Report, we will begin to break down how we can build a trading methodology around this simple understanding of price. Make sure you read our first part on Price Action

***Your capital may be at risk. This material is not investment advice.***

Understanding Price Action Part One

Understanding Price Action Part One

Price Action is Significant with Any Trading Instrument

The most important technical tool a trader can have, without a doubt, is the ability to correctly understand and interpret price. In classical technical analysis there are two types of indicators: lagging and leading. The ultimate leading indicator is price itself. In this special 3 part report, we will: 1. Break down the fundamental elements of price action 2. Analyze charts in order to see it clearly 3. Discuss how to build a trading methodology around an understanding of price action

Fundamental Elements of Price Action
In order to understand price action and how it moves, one must first recognize the force behind price. Humans are the fundamental driving force behind price. This is referred to as behavioral finance. The interesting thing about humans is they tend to do things in patterns—repeatable patterns. And this is how price moves. Price continually moves in repeatable patterns. When a new trader begins to look at charts for the first time it can be quite overwhelming. In fact, it appears to be quite chaotic at first glance.

However, a trained eye does not see chaos at all. In fact, a trained eye sees a degree of order in the apparent chaos. There is an ebb and flow to human behavior, and that ebb and flow is graphically represented on every chart of every instrument that has ever been traded in the history of financial markets. And that is the beauty of embarking on the incredible journey to becoming a master of price action. Price action applies to all financial markets, so not matter whether one is trading currencies, commodities, or equities, if one begins to see price and its true movements, one will have an edge in any market he or she chooses to trade. So the first lesson is to understand there is actually order within the apparent chaos.

We will soon uncover the basics of price action, but first one must understand how to develop an eye to see this order. In parts 2 and 3 of this Special Report, there will be several graphic representations of price and it will be clear in these examples, how it moves, but in order for a trader to see and understand the movement of price in real-time market action, one must spend countless hours observing price. There is no substitute for time. I will share the characteristics and movements of price with you, but you must watch price move time and time and time again on a chart in real-time market action in order to really understand and see it for yourself.

In Malcolm Gladwell’s book, Outliers, he discusses that it takes no less than 10,000 hours of concentrated practice to reach a level of world-class talent in a skill. That amounts to 40 hours per week for 5 years. One can definitely understand the basics of price action rather quickly, but a true mastery takes time. It may or it may not take 10,000 hours, but it does indeed take time. Be patient. As you begin to understand the concepts shared in Parts 2 and 3, take time to simply watch price every day, and notice how it moves. Make sure you read our second part on Price Action Don’t forget to take a sneak peak of our Oracle Trader review which is launching this month.

***Your capital may be at risk. This material is not investment advice.***

Black Mamba Forex

Black Mamba Forex

Using the Black Mamba as a Sidekick
The words “Black Mamba” may be bring one of two images to your mind. First, if you are a basketball fan, it brings to mind the ferociously talented Kobe Bryant, as he is nicknamed the Black Mamba. Second, it may bring to mind an image of the most deadly snake in Africa. Although I do love basketball, and consider Kobe Bryant to be one of the All-Time Greats, this FX Strategy is so named because it shares some key characteristics with the Black Mamba, Africa’s most deadly snake.

The Black Mamba is a poisonous snake in Africa that hunts its prey by hiding and waiting for it to get within striking distance. When its unknowing prey falls within striking distance, the Black Mamba goes to work. This is exactly how we pursue our trade set-ups as traders of the Black Mamba Strategy.

Let’s get to it. Currency pairs do not move an infinite amount of pips per day. In fact, they actually move in a rather predictable pattern. Under normal market conditions, the EUR/USD generally moves about 130 pips. That can increase or decrease depending on certain fundamental drivers, but for the most case, the E/U will generally move that amount.
The aim of this trading strategy is to locate the zone where a currency pair will be exhausting its daily range and then determine whether there are any key levels in those areas that may offer us a high probability reversal point.
The True Black Mamba

Stealth Trading Style
Technically, this is considered a contrarian market approach, since you will be fading market momentum. It is also termed a “reversion to mean” strategy, which statistically is a strategy that is profitable over the long term.

The preparation for this strategy ideally takes place each night between 7-8 pm. At 7 pm est, you want to look at price and measure X amount of pips in each direction, with X being your daily range. I like to calculate the daily range by taking the average over the previous 10 trading days. This will help you stay in alignment with current market conditions instead of simply sticking to a fixed number which could change over time as market conditions change. To find the average, you can either program it in any of the various trading platforms that have learn-able programming language, or you can do it by hand. Mark 7 pm est on your chart for each of the previous 10 trading days and determine how many pips that pair moved each day. Then take the total divided by 10, and voila you have your daily range.

Let’s assume the range is 150 pips for the pair you are looking at. Sometime during the Asian session, draw a horizontal line 150 pips in each direction from the opening price at 7 pm. These 2 lines are the zones where you will now look for a key level of reversal.

The reason I take 7 pm est is because that is the beginning of the new day in London, and London times are what the majority of traders around the world are looking at. Here is an example below.
Playing the Black Mamba
Black Mamba Forex Trading Strategy
Now, you are going to look for key levels within or close to those red boxes where price may offer a reversal.

***Your capital may be at risk. This material is not investment advice.***

Backside Fibs Technique

Backside Fibs Technique

When I started trading years ago, the first system I was introduced to was a very simple strategy that involved Fibonacci. Unfortunately, the Trading system was so simple that it lost money on a consistent basis! But as I continued to evolve and develop from those humble beginnings, I never did stray very far from my Fibs. Along the way, however, I have discovered an alternative use of Fibonacci levels that is incredibly effective. If you currently use Fibs, there is a strong possibility you are only using them at about a 50% rate of efficiency.

Traditional Fib Execution

When I first began using Fibs on a consistent basis, I used them the way that most people do. You identify a swing HI and a swing LO on a chart if price is moving down (reverse in a bullish market), then you draw the Fib tool from the HI to the LO, and Fibonacci retracement levels are automatically populated on your chart. The chart directly below depicts a very clear swing HI and swing LO.
Fibs all Day
What to make of the Fibs

Fibonacci Strategy

The second step is to simply draw your Fibs from the Swing LO to the Swing HI.

Best Fibonacci Strategy

Once you draw the Fibs from Swing LO to Swing HI, your fib levels automatically populate. Now, Fibonacci trading theory states that when price makes an impulsive move from a Swing LO to a Swing HI, it will typically retrace 23%, 38%, 50%, 62%, or 76% of the move before it breaks the Swing HI and continues the move up. A Fib trader is now looking to enter a long position as price pulls back to one of these Fib levels.

In this example above, simply buying EUR/USD at every Fib level is going to be an ineffective strategy. Most Fib traders will use the Fib levels as guides and then look for additional price action confirmation in order to actually enter a trade. Personally, I like to combine heavy areas of support/resistance with my understanding of order flow in order to identify Fib levels that have a high probability of providing enough support to actually bring substantial demand into the market and push price back to the upside.
Let’s see how these Fib levels from the chart above actually held up.
What to make of the Fibs

Fibinacci Strategy That Works

As you can see price did bounce nicely off the 38%, 50%, and 76% Fib levels. However, price did not slow down at all at the 23% and the 62%. Long positions off those two Fib levels would have surely been stopped out. Now, a trader can definitely develop an effective trading approach that is centered around buying at Fib retracements in a bullish market or selling at Fib retracements in a bearish market, but I believe that this traditional approach to Fibonacci trading is only partially effective. There is a whole lot more to understand!!

The Backstory

Several years ago, I was talking on the phone with another professional trader who had been very successful in the Forex market. In passing, he mentioned that he loved to trade off the backside of Fibonacci levels. As a Fib enthusiast, this caught my attention. I had never considered trading off the backside of the fibs. Immediately, I went to the charts and began looking at historical price action, and sure enough I began to notice that price was consistently bouncing off the backside of previously broken Fib levels. Today, trading retests of the backside of previously broken Fibonacci levels is one of my favorite price action setups I use to enter positions in the market.

The Backside of the Fibs

Let’s continue with the same EUR/USD example we used in the previous chart pics.
What Makes a Good Trade

Retracement Strategy

Price retraced all the way down to the 76% retracement before it began rising back to the upside. Notice what happened when price rose to the backside of previously broken Fib levels! First, price raced up to the backside of the 62%. Very little resistance was brought into the market and price continued to rise, but notice what happened as it came to the backside of the 50%. Strong resistance resulted in a near 100 pip reversal. Then, when we finally break through the 50% and move up to the backside of the 38%, price finds strong resistance again and reverses nearly 100 pips.

Probability Theory

Forex Trading is a game of probability. You never win every time. Instead, you develop a strategy and risk model that is designed to produce a positive outcome over a large sample of trades. Therefore, it is always a good idea to research your trading ideas in order to develop parameters and filters that help optimize your Forex strategy. During my research phase of this particular setup, I noticed that Stochastics acted as a very effective filter.

Stochastics and Backside of the Fibs
How to Trade Fibs

Stochastics Strategy

Now, when I identify a backside of the Fib setup, I go to the 15 Minute chart and look at Stochastics (setting: 8,3 ,3). I prefer for Stochastics to confirm an overbought or oversold condition. In the example above, remember the backside of the 62% did not provide resistance. Price broke straight through it. But notice that Stochastics were still wide open and pointing up. Typically, it is not a great idea to sell when Stochs look like that. If you had waited, in this example, for Stochs to hook and cross, you would not have entered until price broke up to the next Fib level, which was the backside of the 50%. And sure enough, you can see that once Stochs hooked and crossed, and price hit the backside of the 50%, price reversed over 100 pips.

Conclusion By utilizing this new approach to Fibonacci trading, you are essentially increasing your efficiency rating by 50%! Remember to always conduct your own exhaustive testing and research of a trading idea before using it in your own trading, and remember there is always the risk of loss. No trading setup will work 100% of the time.

***Your capital may be at risk. This material is not investment advice.***

Finding Your Edge In The Market Part Four

Finding Your Edge In The Market Part Four

Trading Like the Big Boys

The average retail forex trader has little understanding of what truly drives the FX Market. By discovering what drives the investment decisions of large banking and financial institutions, you can not only further refine your understanding of this marketplace, but you can also begin to place trades, knowing what is driving the market. The birth of this understanding in the mind of a trader will foster a psychological atmosphere of confidence and confidence is one of the most powerful attributes a trader can have. A learned, confident trader will often be a profitable, successful trader.

Interest Rates are the fundamental key driver of the FX Market. Without a doubt, this is what drives every currency pair over the long term. In order to understand this in basic terms, let’s use a hypothetical story. Let’s pretend you are an investor, which you are, and your financial advisor presents you with 2 investment opportunities. In the first opportunity, you are going to receive 5% interest on your money for the year. In the second opportunity, you are going to receive 1.5% interest on your money for the year. Let’s assume the risk on both investments is virtually equal. Which investment opportunity are you going to choose? Of course, you are going to choose the opportunity that yields you 5% interest! Why? Because above all things, what do investors want to do with their money? Make more money!!!

This is why interest rates drive the FX Market. Each currency has an interest rate that its Central Bank sets every 2 months. This benchmark interest rate dictates interest rates throughout the entire economy of that country. For example, when the Federal Reserve (Central Bank of USA) increases its benchmark interest rate, then that decision will have a trickle down effect in the entire economy. Banks will increase interest rates on mortgages, car dealerships will increase interest rates on car loans, etc etc. The reason Central Banks raise and lower interest rates is a topic that is beyond the scope of this article. Instead, we want to know why interest rates drive the market and how we can profit from it as traders.

Large banking and financial institutions will generally invest in currencies that yield higher rates of interest. By tracking what currencies have high interest rates, and which currencies are expected to be raising interest rates, you can determine which currencies will most likely appreciate over the long term. By tracking which currencies have low interest rates, and which currencies are expected to be lowering interest rates, you can determine which currencies will most likely depreciate over the long term. Let’s take a quick look at a chart to see this in action.
Trade Like the Big Boys
Trade like the Big Institutional Traders
This chart depicts the rapid growth of the Aussie Dollar versus the US Dollar over a 7 year period as the Reserve Bank of Australia held rates between 5-7% while the Federal Reserve kept interest rates very low ranging from 1-3%. Investors seeking yield bought the AUD/USD during this time. The move yielded over 5,000 pips.

***Your capital may be at risk. This material is not investment advice.***