As we have discussed before, finding your edge in the market is a major key to becoming a professional trader. Your edge in the market is not one particular thing, but more so a combination of factors. It may be your technical strategy that yields statistically positive expectancy over time combined with your money management, psychology, and proprietary tools for analyzing the market. Today, we are going to discuss another factor that holds enormous power to help you further develop and refine your edge in the market: Confluence.
Confluence is literally defined in the dictionary as a coming together of things, a crowd, or a throng. In trading, confluence is a coming together of various factors that determine whether to take a trade. If a trade set-up has strong confluence, that means it has several determining factors, all screaming together for you to take this trade. A trade that lacks confluence may have only 1 factor telling you it’s a good trade. If you begin to move away from trades with weak confluence and only enter trades with strong confluence, you will see a further edge develop in your trading, and you will see your winning percentage continue to increase.
Let’s look at areas of confluence on some charts to get a better visual understanding of this powerful tool.

Support and Resistance
Our first step to finding a trade set-up with strong confluence is to find areas of very clear support and resistance. I like to initially look for these on the Daily Chart and then move down to lower time-frames. Remember it is statistically proven that technical set-ups that occur on higher time-frames are more reliable because they include a wider range of data input. Finding support and resistance on longer time-frames and letting that guide your short-term set-ups is a great way to increase your winning percentage.
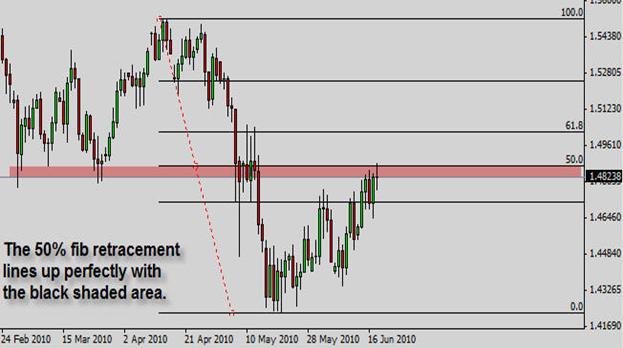
Now, we can add any of the various technical indicators to this chart to see if there are any areas of strong confluence.

Technical Indicators
Now, we can see that there is strong confluence at this area where price is currently holding. Not only has former support turned into resistance, but it also lines up perfectly with a major 50% fib retracement. I was actually planning on taking this trade short at the 50% fib level at 1.4871 for over a week. Unfortunately, I live on the East Coast and this trade triggered during the London Open at 3:30 am est while I was asleep. However, for those who did take this short, they would have sat through a max drawdown of only -12 pips and would have been up over 100 pips within a few hours.


